Maps are visual representations of real-life landscapes. Map scales show the difference between the distance on the map and the distance in real-life. The two types of scale are:
- The graphic scale shows scale using a line with separated sections. One side represents the distance on the map. The other side represents the real-life distance. You measure the distance between two objects on the map. Then you compare it with the distance on the scale.
- The fractional scale uses fractions to describe the ratio between distances on the map and the real world. One unit on the map equals 1,000 units of distance in the real world, eg. 1 centimetre equals 1,000 centimetres (1,000 cm = 10 m) in real life. The fraction is shown as 1:1,000 or 1/1,000.
|
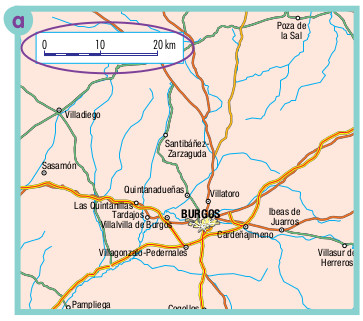
A graphic scale.
|
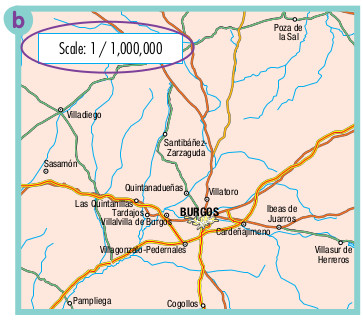
A fractional scale.
|
Small scale and large scale maps
Maps can be small or large scale.
- Small scale maps show a large area. They are called small scale because objects are very small. They can show a whole country but little detail.
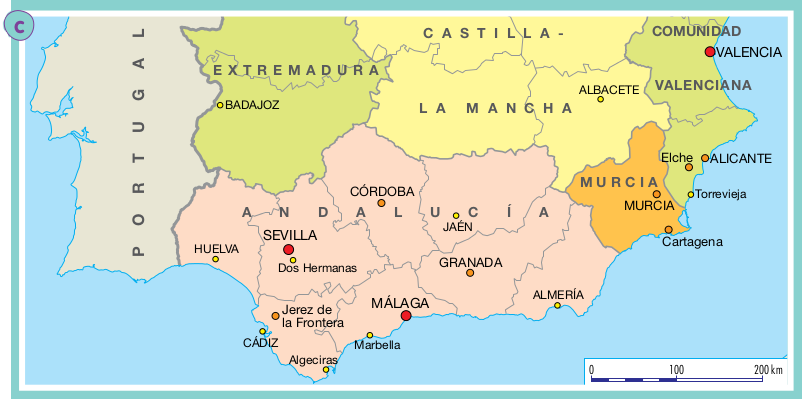
- Large scale maps show a smaller area but in more detail. It shows the objects and landmarks on the map. You can see more details on this map of Malaga than the map of Spain.
|
A small scale map of Spain
|

A large scale map of Malaga
|
Globes and world maps
The Earth is a three-dimensional sphere but a map is only two-dimensional. We use three-dimensional globes to show the Earth more accurately. On both globes and maps there are lines of longitude and latitude. These are imaginary lines that help us locate different places on the Earth.
The most important line of longitude is called the Prime Meridian. It passes trough Greenwich, and is sometimes know as the Greenwich Merididan.
The most important line of latitude is the Equator which divides the Earth into the Northern and Southern hemispheres.
We measure the latitude of a specific place depending on whether it is north or south of the Equator. Longitude is measured in terms of east and west.
On the globe you can also see the North Pole and the South Pole. This is where the Earth's axis passes through. If you look at the globe you can see that it is tilted to show the real-life tilting and rotation of the Earth.
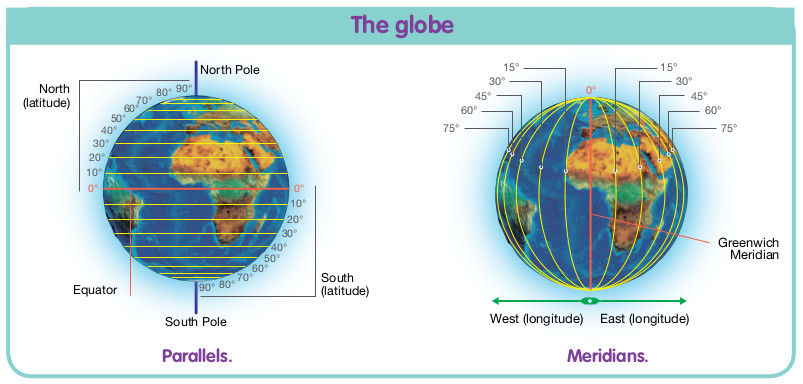

A map of the world showing lines of latitude and longitude.
-
Look at map a. How far is it from Villadiego to Quintanadueñas?
-
Look at map b. How far is it from Villadiego to Pozo de la Sal?
-
Try to answer the following questions without a calculator.
1 How many metres are there in two kilometres?
2 How many centimetres are there in one kilometre?
3 30,500 metres equal how many kilometres?
4 How many centimetres are there in 16 kilometres?
-
Draw a graphic and fractional scale to represent the following distances.
1 One centimetre represents ten kilometres.
2 One centimetre represents forty kilometres.
-
Work with a partner. Take turns asking your partner to calculate two distances. You can use the maps above or a different map.
-
-
Look at map c. How far is it from Cádiz to Jaén?
-
Look at map d. What is the approximate distance between the two statues?
Which map should I use?
These people need to find the right type of map for them. Listen to their needs, then match the person to the correct type of map.