tester

Use of cookies

We use cookies to improve and analyse your browsing experience on our web. You can accept these cookies, reject them or choose your settings by clicking on the corresponding buttons. Please note that rejecting cookies may affect your browsing experience. For more information you can consult our Cookies policy.

Configure cookies

Cookies are an essential part of how our web works. The main goal of cookies is to make your browsing experience more comfortable and efficient and to improve our services and the web itself.
Here you can find all the information about the cookies we use and you can activate and/or deactivate them according to your preferences, except for those cookies that are strictly necessary for the operation of the web. Blocking some cookies may affect your experience on the web and how the site works. For more information you can visit our Cookie Policy.

Strictly necessary (technical) cookies

These Cookies are necessary for the web to function and cannot be disabled on our systems. They are generally only set up in response to actions you may take such as requesting services, setting your privacy preferences, logging in or completing forms. You can set your browser to block or warn you about these cookies, but some parts of the web will not work. Information about Cookies.

Analytical cookies

These Cookies allow us to count the number of visits and traffic sources so that we can measure and improve the performance of our site. They help us to find out which pages are the most popular and least popular, and to see how visitors move around the web. All information collected by these Cookies is aggregated and therefore anonymous. If you do not allow these Cookies we will not know when you visited our web. Information about Cookies.

Third party cookies

These cookies are used to analyse your activity in order to show you personalised advertisements. Information about Cookies.

Accept Decline Configure cookies Confirm selected
Search
×
Notes
Search
There are no notes
  • Scientific method and data analysis
  • To customise Pencil press Alt + Down Arrow
  • To customise Highlighter press Alt + Down Arrow

    Change theme

    Error - please check your internet connection...
    Back

    Blink Help

    x
    Error - please check your internet connection...

    How can we help you?

    No results

    View full manual

    Couldn't find what you were looking for?

    Please describe the issue you are experiencing and provide as many details as possible. Let us know the book, class, access device, licence code, username, used browser or if it occcurs in our app:

    Thickness:
    Font size:
    Filter
      No resources found
      Font size:
      Revision mode

      Revision mode

      Scientific method and data analysis
      Science and measurement
      Without background sound
      Logo

      What is the scientific method?

      The scientific method is the procedure followed by scientists to study problems and reach valid conclusions.

      The scientific method follows a series of steps, which are:

      1. Observation

      2. The hypothesis

      3. Experimentation

      4. Analysing the results

      5. Defining laws and theories

      6. Publishing the results


      Think

      Look at these two containers of water: 

      • Which one do you think will evaporate first?

      • Do you dare to formulate a hypothesis?

      • How could you verify that hypothesis?


      Scientific method and data analysis
      Science and measurement
      Without background sound
      Logo


      Scientific method and data analysis
      Science and measurement
      Without background sound
      Logo

      Are there any shortcuts?

      Sometimes, in science, the scientific method cannot be followed precisely. For example, in astronomy you can only measure what happens in the universe; you cannot experiment with it. You have to continue observing and measuring to find out if your hypothesis true. 
      Scientific method and data analysis
      Science and measurement
      Without background sound
      Logo

      The scientific method: a summary

      Here's a reminder of the six phases of the scientific method.

      Observation
      Scientific method and data analysis
      Science and measurement
      Without background sound
      Logo

      Let's test

      How much do you know about the scientific method?

      Does a hypothesis always have to be verifiable?

      • Not necessarily. Sometimes there is no way to know if it's true.

      • Correct answer
        Wrong answer
      • Yes, it has to be verifiable.

      • Correct answer
        Wrong answer
      • Hypotheses are not theories, so they don't need to be verified.

      • Correct answer
        Wrong answer

      Done
      Scientific method and data analysis
      Science and measurement
      Without background sound
      Logo


      Can you put the steps of the scientific method in the right order ?

      Done
      Scientific method and data analysis
      Science and measurement
      Without background sound
      Logo


      Which of these can predict unknown phenomena?
      • Scientific laws

      • Correct answer
        Wrong answer
      • Scientific theories

      • Correct answer
        Wrong answer
      • Casual discoveries

      • Correct answer
        Wrong answer

      Done
      Scientific method and data analysis
      Science and measurement
      Without background sound
      Logo


      What is a scientific law?
      • It is the statement of an unconfirmed hypothesis.

      • Correct answer
        Wrong answer
      • It is the statement of a confirmed hypothesis.

      • Correct answer
        Wrong answer
      • It is the definition of the problem observed and analysed in the experiment.

      • Correct answer
        Wrong answer
      • The explanation of events proved through scientific laws.

      • Correct answer
        Wrong answer

      Done
      Scientific method and data analysis
      Science and measurement
      Without background sound
      Logo

      Analysing the results

      To be confirmed, a hypothesis must be true in various conditions, so many times several experiments are performed with changes to some of the initial conditions. 

      Therefore, lots of different data is obtained. In order to analyse it, it is necessary to organise it in tables and graphs.

      Tables
      Graphs

      A table allows us to organise data in rows and columns:

      • In each column the data of a characteristic of the problem is represented, that is, of a variable.
      • In each row the values of each variable are arranged for a measurement.

      For example, if we measured the speed with which two balls of different mass go down an inclined plane we would obtain  data like this:

      Ball A (50 g)

      Length (m) Time (s)
      0.25 0.34
      0.50 0.48
      0.75 0.59
      1.00 0.68


      Ball B (22 g)
      Length (m) Time (s)
      0.25 0.34
      0.50 0.48
      0.75 0.59
      1.00 0.68

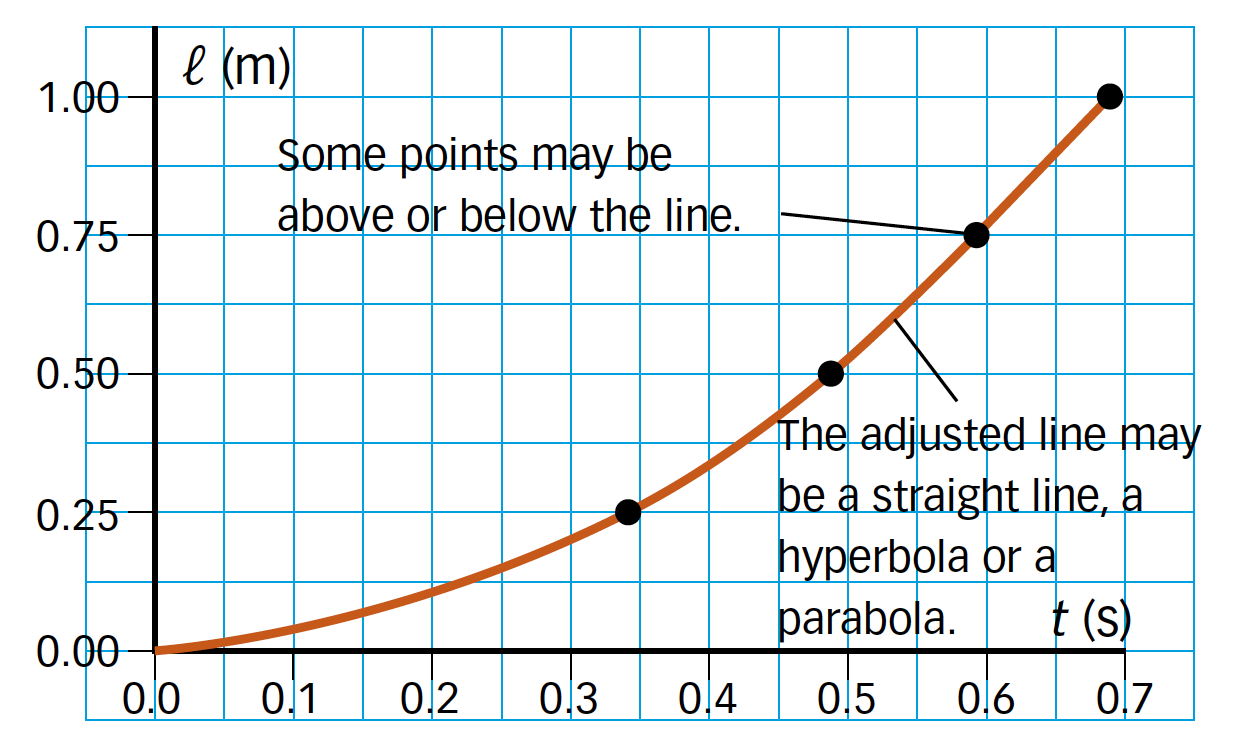
      The graphs show the data obtained in a visual way. For example, the graphs show the relationship between two variables and allow us to know values that we have not measured:

      • Interpolating data is to obtain intermediate values to other measured ones.
      • Extrapolating data is to obtain values outside the range of those that have been measured

      For example, for Ball A, a graph like this may be obtained:


      Scientific method and data analysis
      Science and measurement
      Without background sound
      Logo

      What's the robot doing?

      In an experiment a robot is programmed to move at different speeds, and in each case the time it takes to travel a previously set distance is measured. Observe the chart. 

      v (m/s) 20 16 10 5 4 2 1.25
      t (s) 1 1.25 2 4 5 10 16


      a) Let's represent the data in the corresponding graph.


      b)
       Which law can be deduced from this data?

      The graph shows a rectangular hyperbolic curve, therefore:

      • We can express the law as "The speed of the robot is inversely proportional to the time that it takes in to travel a determined distance".
      • The mathematical equation for this law is v por t igual k. 
      • In all measurements, the product of v por t igual 20, which is the distance it travels in all cases. That's why it coincides with the expression that relates speed with time and space travelled: v por t igual d

      c) How fast does the robot go after 8 s?

      In the graph we read that when t = 8 s, v = 2.5 m/s.

      This result can also be obtained by substituting in the mathematical expression:

      v igual fracción d entre t igual fracción numerador 20 espacio normal m entre denominador 8 espacio normal s fin fracción igual 2.5 espacio normal m dividido por normal s


      Scientific method and data analysis
      Science and measurement
      Without background sound
      Logo

      How to interpret a graph

      When we plot the data in a graph, the resulting lines are telling us the relationship between magnitudes.

      Ascending straight line
      Descending straight line
      Rectangular hyperbolic curve

      An ascending straight line represents direct proportionality between the two variables represented.

      There are two possibilities:

      • The line goes through the origin.
      • The line doesn’t go through the origin.


      Line goes through the origin

      Line doesn't go through the origin

      Mathematical expression

      y = k · x

      Mathematical expression

      y = k · x + n


      A descending straight line means that the decrease of one variable is directly proportional to the other variable.

      Mathematical expression y = -k · x + n

      In this example, the graph shows that one variable is inversely proportional to the other one. The higher variable x is, the lower variable y will be.

      Mathematical expression y · x = k


      Scientific method and data analysis
      Science and measurement
      Without background sound
      Logo

      How are rainbows formed?

      Imagine you are studying the phenomenon of rainbows.

      • What questions can you ask to help you understand it?
      • Formulate some hypotheses to explain this phenomenon.
        Don't worry about whether these hypotheses are true or not. What's important is that they're rational and verifiable.
      (0 words)

      Done
      Scientific method and data analysis
      Science and measurement
      Without background sound
      Logo

      Are they hypotheses?

      Do the following statements correspond to a scientific hypothesis?

      • The height reached by a body thrown upwards depends on the color of the object being thrown.
      • Correct answer
        Wrong answer
      • The height reached by a body thrown upwards depends on the initial velocity we give it.
      • Correct answer
        Wrong answer
      • The height reached by a body thrown upward is related to what the person throwing it thinks.
      • Correct answer
        Wrong answer

      Done
      Scientific method and data analysis
      Science and measurement
      Without background sound
      Logo

      Hypotheses, laws and theories

      Taking into account the phases of the scientific method:

      a) Explain the difference between a law and a hypothesis.

      b) Explain the difference between a law and a theory.

      c) Give an example for each of these concepts.

      (0 words)

      Done
      Scientific method and data analysis
      Science and measurement
      Without background sound
      Logo

      Analyse the data of a graph

      Look at the graph and choose which of the following statements is correct.

      • When the elapsed time doubles, the space travelled also doubles.

      • Correct answer
        Wrong answer
      • The space travelled decreases as time elapses.

      • Correct answer
        Wrong answer
      • There is no apparent relationship between elapsed time and space travelled.

      • Correct answer
        Wrong answer
      • During the period between second 3 and second 4 more space is travelled than during the period 1 s -2 s.

      • Correct answer
        Wrong answer

      Done
      Scientific method and data analysis
      Science and measurement
      Without background sound
      Logo

      Plot the data on a graph

      Look at the table below:

      Circumference (mm) 73.01 76.17 62.02 66.73 58.88
      Diameter (mm) 23.25 24.25 19.75 21.25 18.75

      Plot a graph in your notebook of the length of the circumference versus the diameter. Take a picture of it and complete the exercise by attaching your file.

      My files
      Upload file
      Title Classroom Date Download Delete
      You have not submitted a file.

      Done
      Scientific method and data analysis
      Science and measurement
      Without background sound
      Logo


      What's the relationship between the two magnitudes?

      • They're not related.

      • Correct answer
        Wrong answer
      • They are directly proportional.

      • Correct answer
        Wrong answer
      • They are inversely proportional.

      • Correct answer
        Wrong answer

      Done
      Scientific method and data analysis
      Science and measurement
      Without background sound
      Logo

      Now I know


      What is the scientific method?
      subtitulo

      It's a procedure used by scientists to reach valid conclusions about the world.


      The phases of the scientific method
      subtitulo

      1. Observation

      2. Hypothesis

      3. Experimentation

      4. Analysis of the results

      5. Definition of laws and theories

      6. Publication of the results


      Graphs
      subtitulo

      When we plot data in a graph, the resulting lines tell us the relationship between the magnitudes analysed.


      ,
      You have completed the lesson!

      Below is the time you have spent on the activity and the score you obtained.

      Time spent

      Score

      1. 1
      2. 2
      3. 3
      4. 4
      5. 5
      6. 6
      7. 7
      8. 8
      9. 9
      10. 10
      11. 11
      12. 12
      13. 13
      14. 14
      15. 15
        Eraser
        Rich text editor
        close